In most property markets, prices do not fall first.
Volume falls first.
The market goes quiet. Buyers stop answering calls. Viewings continue, but offers become thinner. Sellers say they are not in a rush. Brokers start using softer language: a pause, a reset, a more selective market. Everyone avoids the word that actually matters.
Liquidity.
That is what happened in Dubai in March and April 2026.
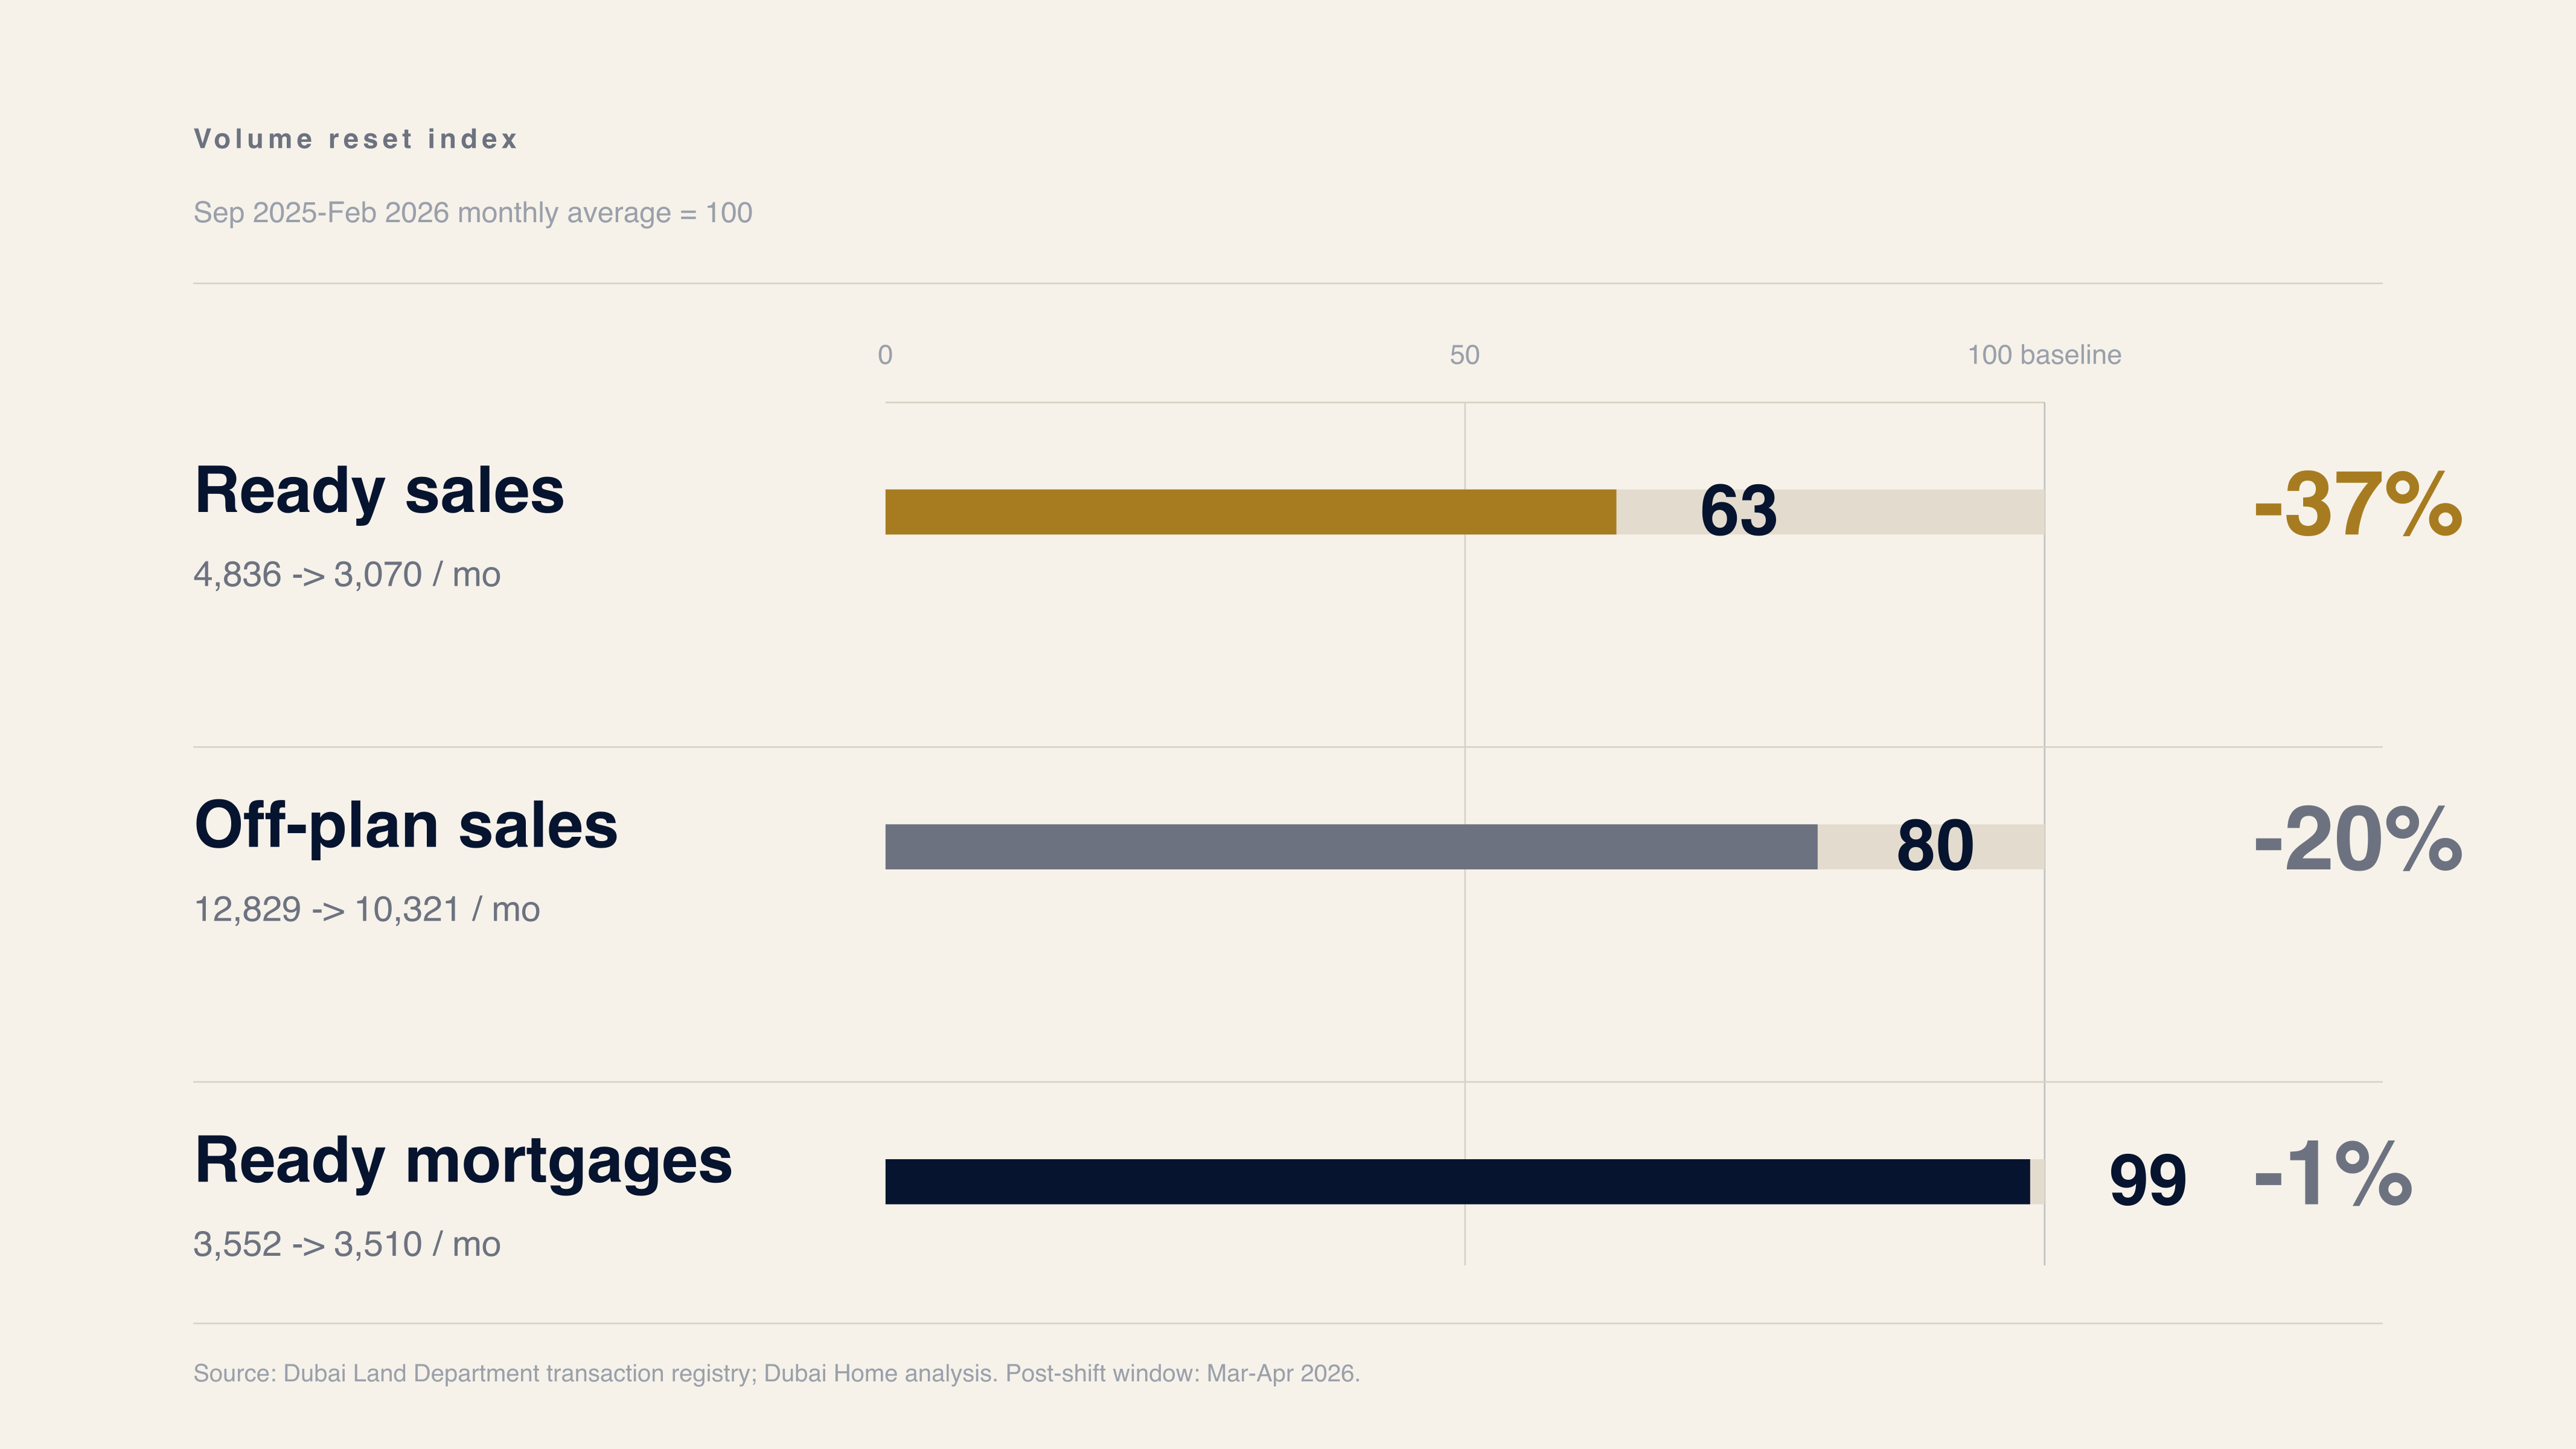
The simple version is that Dubai residential transaction volume fell sharply after the late-February shift in global risk appetite. Ready sales dropped 37% versus the prior six-month run rate. Off-plan sales fell 20%. By the standards of the 2023-2024 momentum market, when almost anything with a payment plan could find a buyer, the market suddenly felt slower.
But the stranger part is what did not happen.
Prices did not immediately collapse. Mortgage-backed ready demand stayed broadly stable. Median PSF held across several large apartment markets. Off-plan developers continued clearing units at higher median prices than a year earlier. Ultra-luxury registrations did not disappear.
So what kind of slowdown was this?
Not a crash. Not yet.
It was something more interesting: a cash buyer strike.
Prices Do Not Fall First. Volume Does.
Property markets are not stock markets. There is no continuous order book. There is no single live price. There are asking prices, broker opinions, valuation memories, developer price lists, buyer offers, bank valuations, and occasional transactions.
When demand weakens, the first response is rarely a clean repricing. Sellers anchor to yesterday's price. Buyers underwrite tomorrow's risk. The gap between the two sides widens. Transactions slow before values visibly reset.
That is why the March-April data is important. The volume move was obvious. Ready sales fell from a September-February average of 4,836 per month to 3,070 per month. Off-plan sales moved from 12,829 per month to 10,321. But ready mortgage registrations moved from 3,552 per month to 3,510, almost unchanged.
The asymmetry is the story.
The data does not prove that every missing buyer was a pure cash buyer. Dubai Land Department categories are transaction categories, not a perfect psychology survey. But the divergence between ready sales and ready mortgage registrations is a useful signal. The cash-sensitive liquidity layer of the ready market thinned first. The steadier mortgage-backed layer did not vanish.
Who Actually Stepped Back?
The buyers who can wait tend to wait first.
These are not necessarily distressed buyers, and they are not necessarily bearish forever. They are discretionary. They may have cash, alternatives, and no urgent need to close. They are watching equities, rates, currencies, geopolitical headlines, and the tone of the local market at the same time.
When uncertainty rises, they do not have to panic. They can simply stop bidding.
That matters because cash-sensitive buyers are often the market's liquidity layer. They are not always the deepest source of demand, but they are often the fastest. They help weak sellers clear. They give brokers price discovery. They turn a listing into a transaction.
When they step back, the market does not immediately crash. It freezes.
The question is not whether mortgage buyers can carry the market on their own. It is how much support their steadier demand can provide while discretionary cash-sensitive buyers remain cautious.
Why Sellers Refused to Mark Down
In a thin market, sellers often look stronger than they are.
A seller who does not transact can still hold an asking price. A developer with payment-plan flexibility can protect headline PSF by adjusting incentives elsewhere. An owner with no debt pressure can simply wait for the next buyer. A broker can still say the unit is well priced because the last comparable sale was higher.
This is why price data can lag liquidity data. If fewer sellers accept lower bids, the recorded price series may look stable even as the market becomes harder to clear.
The April 2026 tape showed exactly that. Ready sales volume was sharply lower, but median PSF did not produce a broad collapse. Some investor-heavy corridors softened more visibly, especially where discretionary capital and new off-plan supply overlap. Other areas held better, helped by end-user demand, yield buyers, or established rental depth.
The market was not uniformly strong. It was selective. And selectivity is what often appears between boom and bust.
The Off-Plan Exception
Off-plan did not escape the slowdown. Sales volume fell 20% against the prior six-month average and 15% versus April 2025.
But off-plan pricing behaved differently. April 2026 registered a higher median PSF than April 2025. That is not what a discount-led clearing market usually looks like.
The reason is structural. Off-plan is not only a property market. It is also a payment-plan market. Developers can change the rhythm of capital calls, stretch payment schedules, launch in phases, protect price lists, and sell optionality. Buyers are not merely buying square footage today; they are buying time, leverage, and future exposure.
That makes off-plan slower to reveal stress. Volume can cool before headline prices adjust. Incentives can move before PSF does. The real test often comes later, when projects approach handover and speculative buyers must either pay, finance, rent, or resell.
What Breaks the Stand-Off?
A stand-off ends when one side becomes impatient.
If cash-sensitive buyers regain confidence, the market can start clearing again without a dramatic price reset. Volume returns first. Brokers call it renewed momentum. Sellers feel validated. Developers keep the price tape intact.
If sellers lose patience, the adjustment becomes more visible. Asking prices soften. Negotiation gaps narrow. Older listings get marked down. The price series catches up to what liquidity was already saying.
The useful question, therefore, is not simply "are prices down?"
The better questions are: how long do cash-sensitive buyers stay cautious? How much support can steady mortgage-backed demand provide in a thinner liquidity environment? Which sellers need to clear, and which can wait? What happens when today's off-plan supply becomes tomorrow's ready-market competition?
Those are the questions that matter because property cycles usually turn quietly before they turn obviously.
The Bottom Line
The March-April 2026 data does not support a simple crash narrative. It also does not support a simple strength narrative.
It shows a market where liquidity thinned before prices fully adjusted. Ready sales fell sharply. Off-plan cooled but kept pricing power. Mortgage-backed ready demand remained broadly stable. Sellers, for now, held their line.
This is the phase of a property cycle that is easiest to misread. The market is not broken. But it is no longer moving with the same ease.
Methodology & Data Sources
Source: Dubai Land Department transaction registry; Dubai Home analysis.
Baseline: Monthly average for September 2025-February 2026. Post-shift window: March-April 2026.
Volume categories: Ready sales, off-plan sales, and ready mortgage registrations are grouped from DLD transaction categories. The ready-sales category is treated as a cash-sensitive liquidity proxy, not as a perfect identification of every buyer's financing source.
Limitations: DLD records are registration data and can be affected by registration timing, non-standard transfers, and transaction-category definitions. This article interprets market structure from aggregate patterns, not individual buyer intent.