Looking Ahead
What's Coming Next
Generational infrastructure bets that will reshape connectivity and property values
Dubai's real estate trajectory cannot be understood in isolation from the infrastructure investments currently underway. Three mega-projects, collectively representing over AED 200 billion in committed capital, will fundamentally alter the city's geography of value over the next decade. Each project creates new corridors of connectivity, shifts commuter patterns, and opens previously peripheral communities to mainstream demand.
 AI-generated reference image
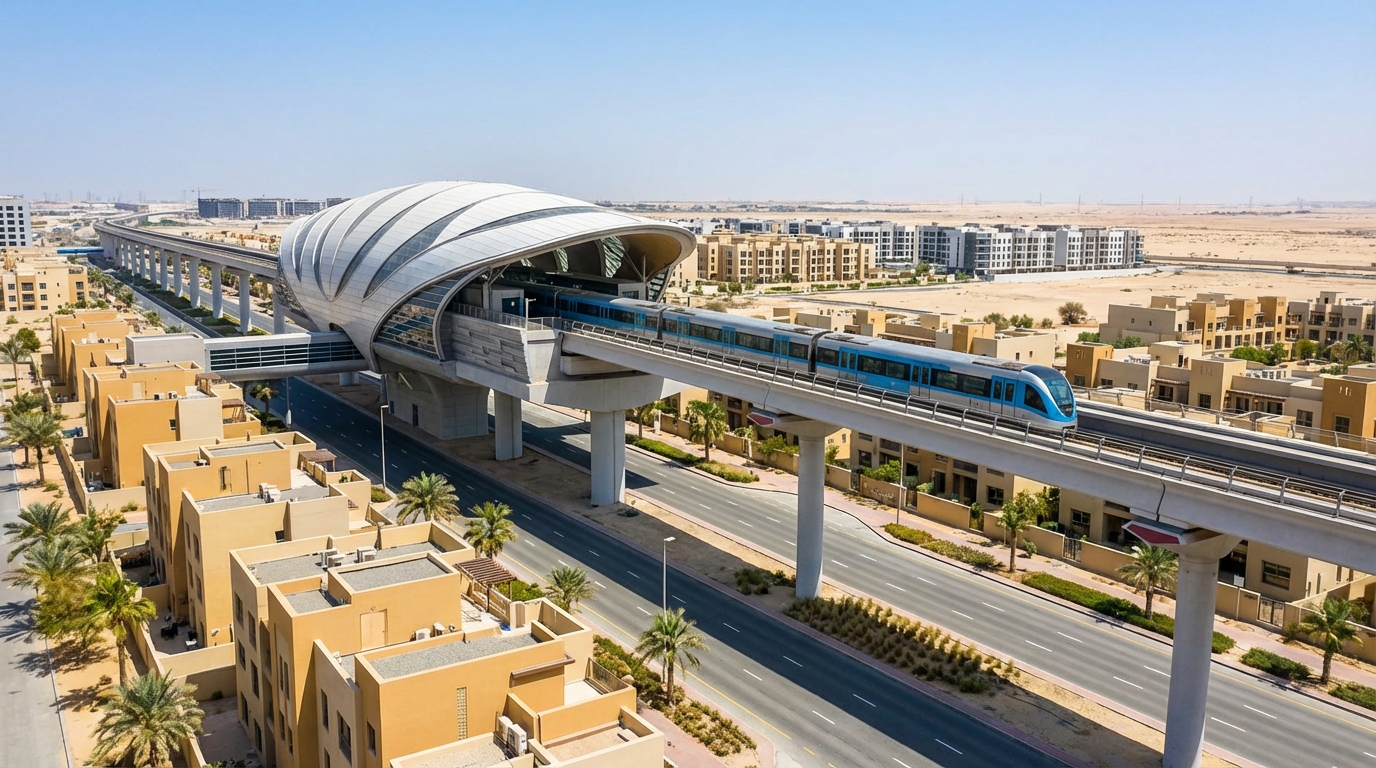
Dubai Metro Blue Line
30 km
14 stations connecting underserved corridors
The third metro line will link Dubai International Airport to key residential corridors including Al Jadaf, International City, and Academic City. Communities along the Blue Line corridor currently trade at significant PSF discounts to metro-connected areas. Historical data from Red and Green Line launches shows 15-25% appreciation premiums within 500 meters of new stations.
Status: RTA approved, construction tendering phase
Timeline: Completion targeted before 2030
 AI-generated reference image
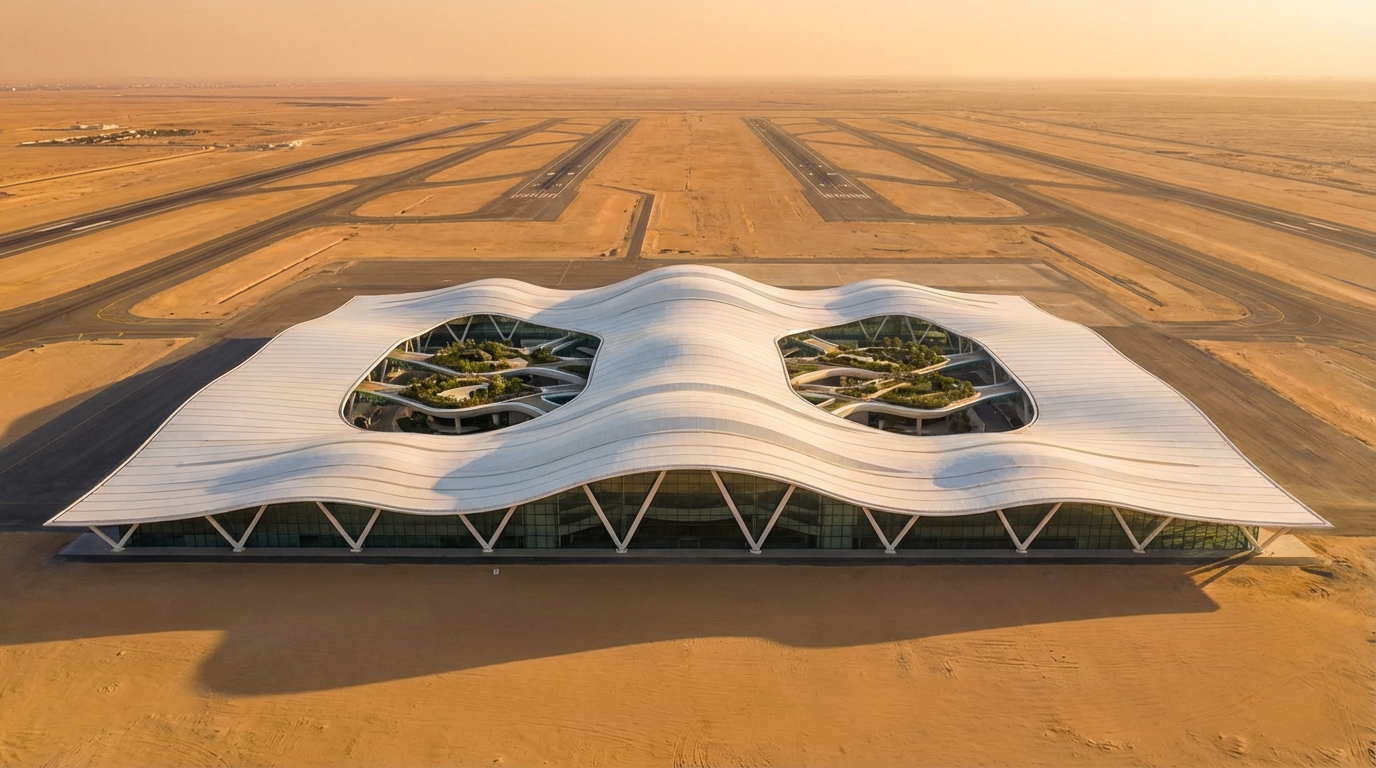
Al Maktoum International Airport
AED 128B
260 million annual passenger capacity at full build
The world's largest airport will anchor Dubai South, a planned city the size of Singapore. Phase 1 activation alone is projected to create over 100,000 jobs in the surrounding logistics, aviation, and hospitality sectors. Dubai South residential communities currently trade at AED 800-1,200 PSF, among the most affordable in the city. The airport's gravitational pull on employment and connectivity could catalyze the same value compression seen around DXB Terminal 3.
Status: Construction commenced, enabling works underway
Scale: 5x Terminal 3 capacity at full build-out
 AI-generated reference image
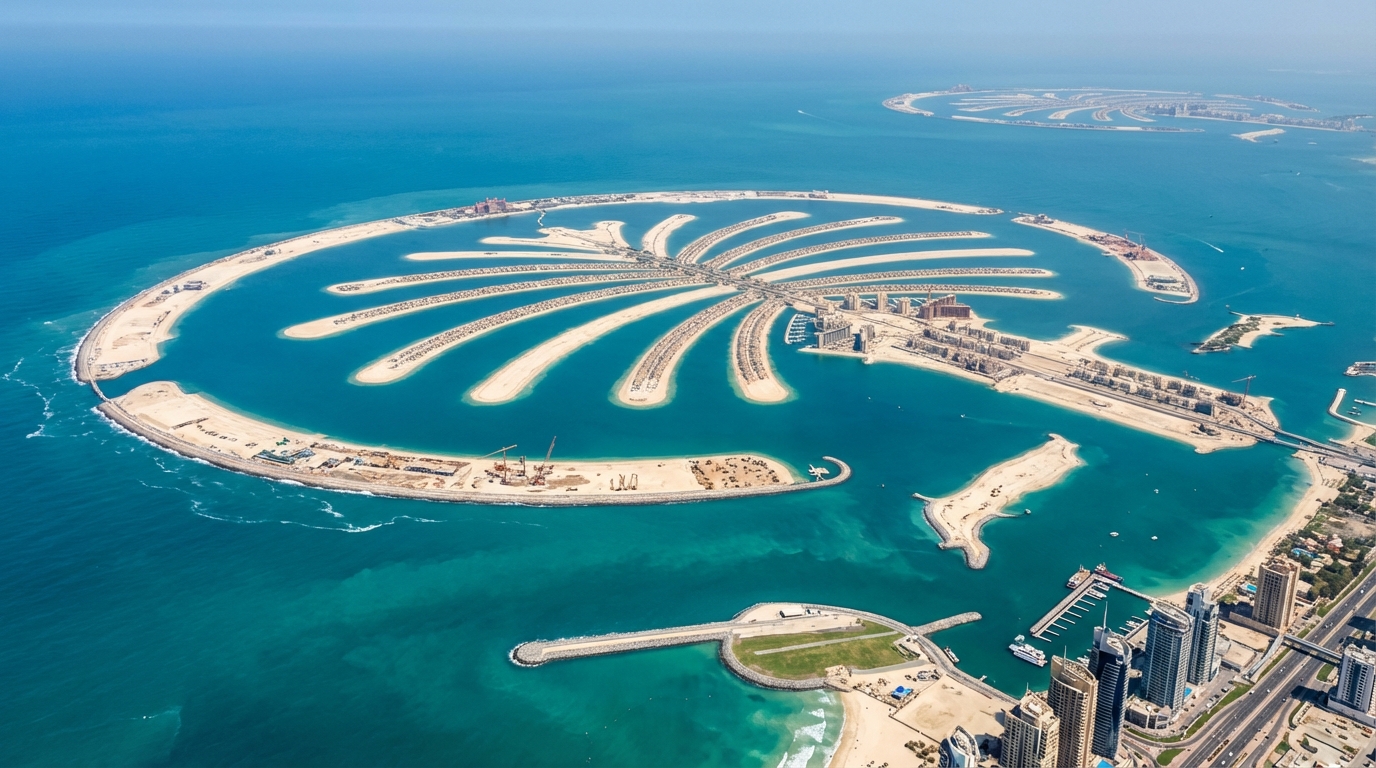
Palm Jebel Ali Revival
110 km
New coastline with 80 hotels and over 35,000 residences
Originally shelved during the 2008 financial crisis, Palm Jebel Ali has been revived as a landmark waterfront destination by Nakheel. At twice the size of Palm Jumeirah, the project will add significant premium inventory to the market. Adjacent communities including Dubai Maritime City and JBR could benefit from the expanded coastline effect, though the sheer scale of new supply will require careful absorption monitoring over a multi-year handover cycle.
Status: Reclamation and infrastructure in progress
Impact: 110 km of new coastline added to Dubai
Market Context
These three projects represent a deliberate strategy to expand Dubai's geographic footprint rather than densify existing corridors. For investors, the implication is a potential bifurcation: established communities near new infrastructure will see connectivity premiums, while some may face increased competition from new supply entering the market. The historical pattern from Palm Jumeirah and DIFC development suggests that infrastructure-led value creation typically takes 5-8 years to fully materialize, with early entrants capturing the steepest appreciation curves.